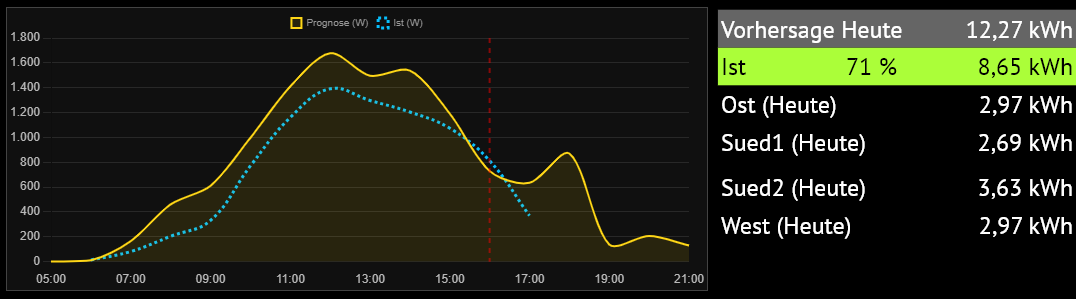
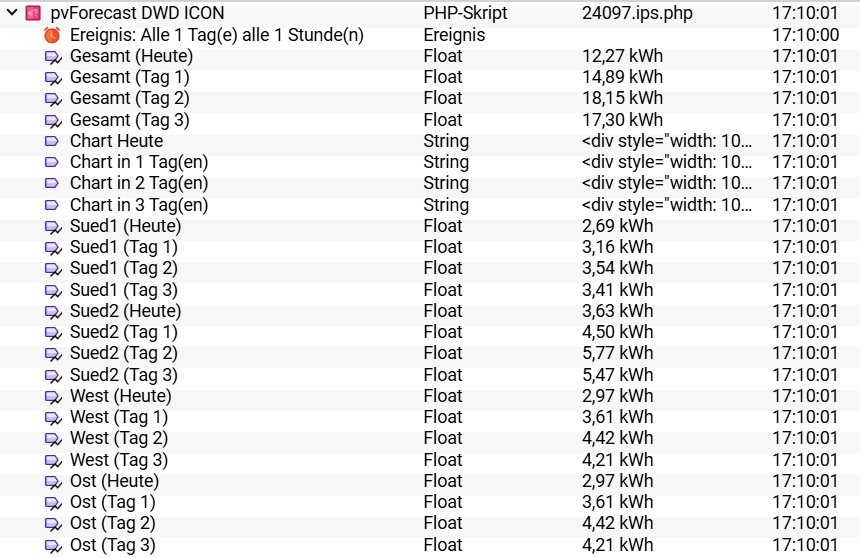
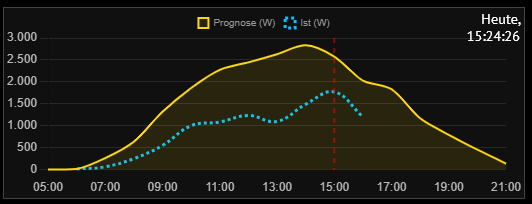
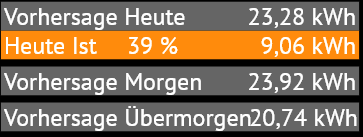
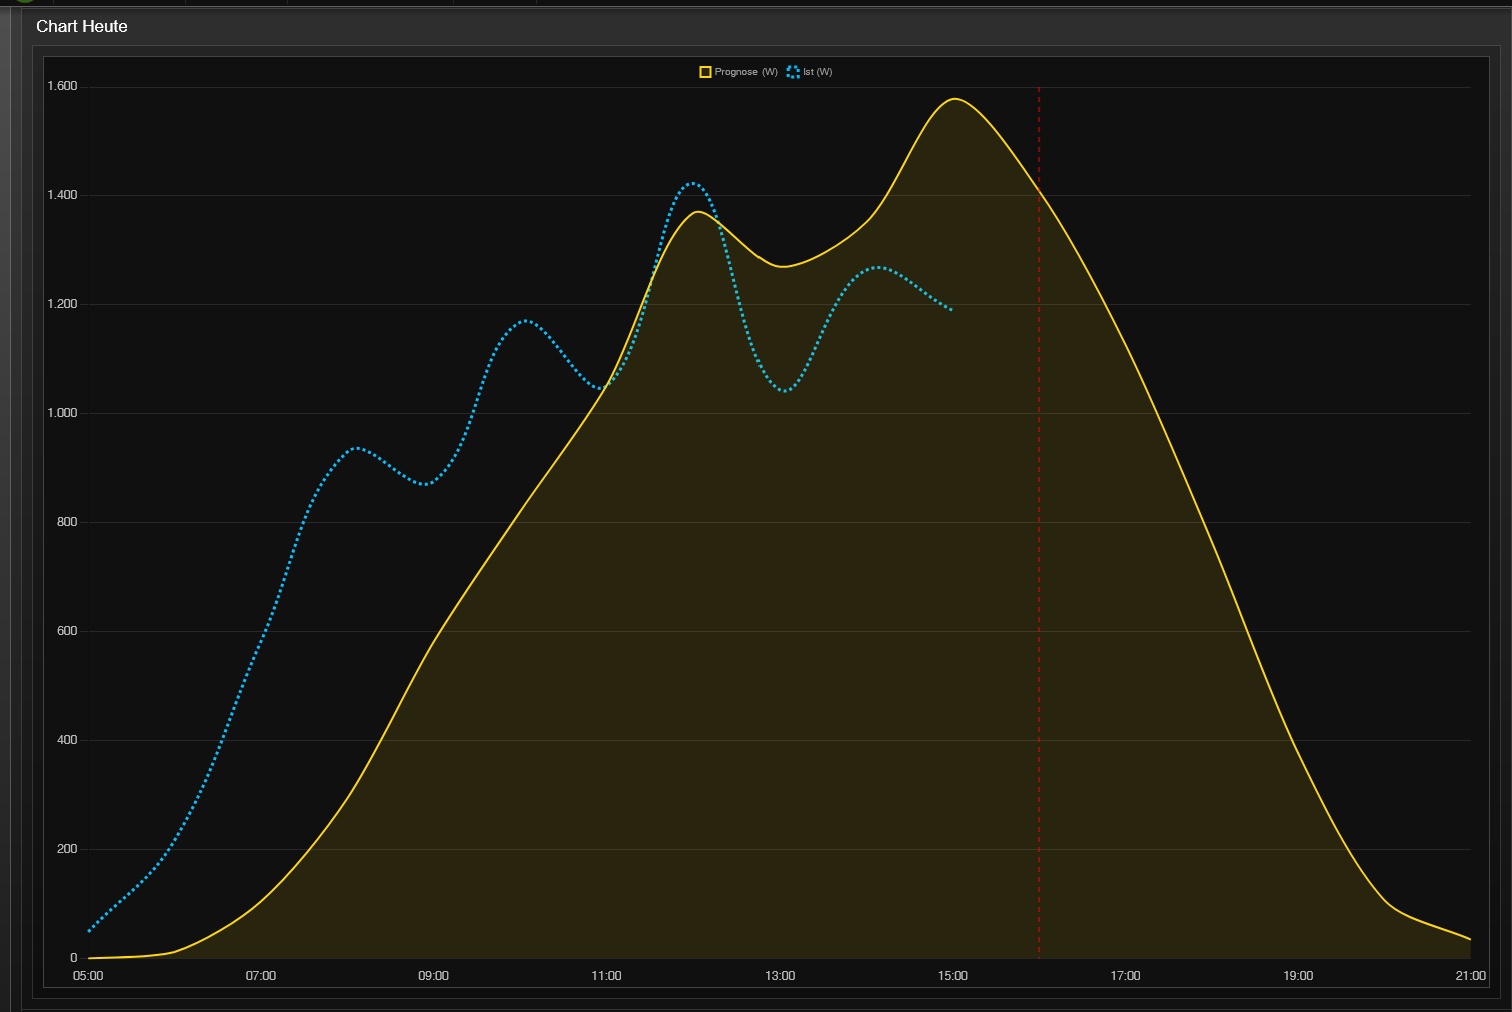
Läuft auch bei mir wieder😀.
Mir fällt das sofort auf, weil sich meine Heizung (Estrichtemperierung ohne Einzelraumregelung), nach dem forecast richtet.
Läuft auch bei mir wieder😀.
Mir fällt das sofort auf, weil sich meine Heizung (Estrichtemperierung ohne Einzelraumregelung), nach dem forecast richtet.
Bei mir läuft es jetzt auch wieder ordentlich, anscheinend hatte solcast.com einen kleinen Schluckauf 
Gruß Heiko
Es könnte sein, dass die Werte einfach Null waren, auch beim DWD gab es die letzten drei Tage nix und Sonne habe ich nicht gesehen.
Jein, das Script hat ja auch bei mir fehler geworfen!
Übrigens sind nur noch 10 Requests / Day zulässig  Nix ist umsonst nur der T…)
Habe es jetzt von 5 bis 21 Uhr aller 2 Stunden und ein Mitternachts Update eingestellt
Gruß HEiko
Ich nutze seit einiger Zeit die DWD Icon Daten (https://api.open-meteo.com/v1/dwd-icon), die gibt es stündlich und die Qualität ist relativ korrekt.
Wenn du möchtest, schicke ich dir gern mein Script zum Umbau/Erweiterung.
ich hätte Interesse!
Danke
richimaint
Da sind wir dabei … das ist prima 
Wie macht da das Setup für die eigene Anlage?
Dann auch hier vollständig rein , eigentlich sollte es reichen oben die Daten einzutragen. Die Variablennamen sind hoffentlich sprechend, sonst bitte fragen.
Einzige externe Abhänggkeiten sind
$id_lokale_temp - die ich von einem lokalen Wettersensor nehme und
$id_ist_gesamt_kw - was bei mir die Summe der gesamten IST Erzeugung ist und für die blaue Linie genutzt wird
Im Panel Array einfach Zeilen weglassen, wenn weniger Ausrichtungen vorhanden sind.
Timer muss manuell angelegt werden, bei mir auf xx:10, weil die Daten immer gegen voller Stunde aktualisiert werden soll(t)en.
Unterhalb des Scripts wird alles automatisch angelegt.
<?php

// ==========================================
// KONFIGURATION
// ==========================================
$lat = 52.42xxx;
$lon = 9.805yyy;

$panels = [
    'Sued1' => ['kwp' => 0.88, 'tilt' => 60, 'azimuth' => 12],
    'Sued2' => ['kwp' => 1.00, 'tilt' => 30, 'azimuth' => 12],
    'West'  => ['kwp' => 0.88, 'tilt' => 45, 'azimuth' => 78],
    'Ost'   => ['kwp' => 0.88, 'tilt' => 45, 'azimuth' => -92]
];

// Falls du mal merkst, dass die Prognose an sehr klaren Tagen systematisch zu niedrig oder zu hoch ist,
// kannst du den Temperatur-Koeffizienten ($temp_coeff = -0.29) oder den Faktor für die Zell-Erwärmung
// (0.025) in der Zeile $t_cell = ... minimal anpassen. Das ist quasi das "Feintuning" für dein spezifisches
// Modulverhalten bei Hitze.
$temp_coeff = -0.29;
$t_ref = 25.0;

$id_lokale_temp = 20861;
$id_ist_gesamt_kwh = 37275;

//-----

$archiveID = IPS_GetInstanceListByModuleID('{43192F0B-135B-4CE7-A0A7-1475603F3060}')[0];
$parentID = $_IPS['SELF'];

// ==========================================
// VARIABLEN ANLEGEN
// ==========================================
for ($i = 0; $i <= 3; $i++) {
    $dayLabel = ($i == 0) ? "Heute" : "Tag $i";
    CreateVariableByIdent($parentID, "Total_kWh_Day_$i", "Ertrag Gesamt ($dayLabel)", 2, $i + 10, "kWh");
    CreateVariableByIdent($parentID, "HTML_Day_$i", "Chart $dayLabel", 3, $i + 20, "~HTMLBox");
    foreach ($panels as $key => $p) {
        CreateVariableByIdent($parentID, "kWh_{$key}_Day_$i", "Ertrag $key ($dayLabel)", 2, $i + 100, "kWh");
    }
}

// ==========================================
// DATENABRUF & BERECHNUNG (Deine Original-Logik)
// ==========================================
$url = "https://api.open-meteo.com/v1/dwd-icon?latitude=$lat&longitude=$lon&hourly=temperature_2m,direct_radiation,diffuse_radiation&forecast_days=4&timezone=Europe%2FBerlin";
$json = @file_get_contents($url);
if (!$json) return;

$data = json_decode($json, true);
$hourly = $data['hourly'];
$rad_to_deg = M_PI / 180;
$days_data = [];

$current_temp = IPS_VariableExists($id_lokale_temp) ? GetValue($id_lokale_temp) : 20;
$current_hour_str = date('Y-m-d H');

foreach ($hourly['time'] as $index => $timestamp) {
    $ts = strtotime($timestamp);
    $dateKey = date('Y-m-d', $ts);
    $hourStr = date('Y-m-d H', $ts);

    $temp_air = ($hourStr == $current_hour_str) ? $current_temp : $hourly['temperature_2m'][$index];
    $hourly_sum = 0;

    foreach ($panels as $key => $p) {
        // ZURÜCK ZUR BEWÄHRTEN FORMEL
        $total_rad_tilted = ($hourly['direct_radiation'][$index] * cos($p['tilt'] * $rad_to_deg)) + $hourly['diffuse_radiation'][$index];

        $t_cell = $temp_air + ($total_rad_tilted * 0.025);
        $p_out = ($total_rad_tilted / 1000) * $p['kwp'] * 1000 * (1 + (($temp_coeff / 100) * ($t_cell - $t_ref)));
        $p_out = max(0, $p_out);

        $days_data[$dateKey]['groups'][$key][] = $p_out;
        $hourly_sum += $p_out;
    }
    $days_data[$dateKey]['times'][] = date('H:i', $ts);
    $days_data[$dateKey]['values'][] = round($hourly_sum);
}

// ==========================================
// IST-WERTE (Mit +1h Shift)
// ==========================================
$istValuesFinal = array_fill(0, 17, null);
if (IPS_VariableExists($id_ist_gesamt_kwh)) {
    $logData = AC_GetLoggedValues($archiveID, $id_ist_gesamt_kwh, strtotime("today 00:00:00"), time(), 0);
    if ($logData && count($logData) > 1) {
        $logData = array_reverse($logData);
        $tempIst = [];
        for ($i = 1; $i < count($logData); $i++) {
            $delta_kwh = $logData[$i]['Value'] - $logData[$i-1]['Value'];
            $delta_t = $logData[$i]['TimeStamp'] - $logData[$i-1]['TimeStamp'];
            if ($delta_t > 0 && $delta_kwh >= 0) {
                $watt = ($delta_kwh * 3600 / $delta_t) * 1000;
                $h = (int)date('H', $logData[$i]['TimeStamp']);

                // --- KORRIGIERTER SHIFT +1 ---
                $shifted_h = $h + 1;
                if ($shifted_h >= 5 && $shifted_h <= 21) {
                    $tempIst[$shifted_h][] = $watt;
                }
            }
        }
        foreach ($tempIst as $h => $vals) {
            $istValuesFinal[$h - 5] = round(array_sum($vals) / count($vals));
        }
    }
}

// ==========================================
// OUTPUT (Summen & HTML)
// ==========================================
$dayIndex = 0;
foreach ($days_data as $date => $content) {
    if ($dayIndex > 3) break;

    SetValue(IPS_GetObjectIDByIdent("Total_kWh_Day_$dayIndex", $parentID), array_sum($content['values']) / 1000);
    foreach ($panels as $key => $p) {
        SetValue(IPS_GetObjectIDByIdent("kWh_{$key}_Day_$dayIndex", $parentID), array_sum($content['groups'][$key]) / 1000);
    }

    $fLabels = []; $fValues = []; $nowIdx = null;
    foreach ($content['times'] as $idx => $time) {
        $h = (int)substr($time, 0, 2);
        if ($h >= 5 && $h <= 21) {
            $fLabels[] = $time;
            $fValues[] = $content['values'][$idx];
            if ($dayIndex == 0 && $h == (int)date('H')) $nowIdx = count($fLabels) - 1;
        }
    }

    $datasets = [[
        "label" => "Prognose (W)", "data" => $fValues, "borderColor" => "#FFD700",
        "backgroundColor" => "rgba(255, 215, 0, 0.1)", "fill" => true, "tension" => 0.3, "pointRadius" => 0, "borderWidth" => 2
    ]];

    if ($dayIndex == 0) {
        $datasets[] = [
            "label" => "Ist (W)", "data" => $istValuesFinal, "borderColor" => "#00BFFF",
            "backgroundColor" => "transparent", "fill" => false, "tension" => 0.4, "pointRadius" => 0, "borderWidth" => 3, "borderDash" => [3, 3],
            "spanGaps" => true
        ];
    }

    $html = generateCombinedChartHTML("chart_" . $dayIndex, $fLabels, $datasets, $nowIdx);
    SetValue(IPS_GetObjectIDByIdent("HTML_Day_" . $dayIndex, $parentID), $html);
    $dayIndex++;
}

// ==========================================
// HILFSFUNKTIONEN
// ==========================================

function CreateVariableByIdent($parent, $ident, $name, $type, $position, $profile = "") {
    $vid = @IPS_GetObjectIDByIdent($ident, $parent);
    if ($vid === false) {
        $vid = IPS_CreateVariable($type);
        IPS_SetParent($vid, $parent);
        IPS_SetName($vid, $name);
        IPS_SetIdent($vid, $ident);
        IPS_SetPosition($vid, $position);
    }
    if ($profile != "" && IPS_VariableProfileExists($profile)) IPS_SetVariableCustomProfile($vid, $profile);
    return $vid;
}

function generateCombinedChartHTML($id, $labels, $datasets, $nowIdx) {
    $jsonLabels = json_encode($labels);
    $jsonDatasets = json_encode($datasets);
    return '
    <div style="width: 100%; height: 100%; background: #111; display: flex; flex-direction: column; border: 1px solid #444; box-sizing: border-box; overflow: hidden;">
        <canvas id="'.$id.'"></canvas>
    </div>
    <script src="https://cdn.jsdelivr.net/npm/chart.js@4.4.1/dist/chart.umd.min.js"></script>
    <script>
        (function() {
            const vLine = { id: "vLine", afterDraw: (c) => {
                if (c.config.options.nowIdx !== null) {
                    const ctx = c.ctx; const x = c.scales.x.getPixelForValue(c.config.options.nowIdx);
                    ctx.save(); ctx.beginPath(); ctx.moveTo(x, c.scales.y.top); ctx.lineTo(x, c.scales.y.bottom);
                    ctx.lineWidth = 2; ctx.strokeStyle = "rgba(255, 0, 0, 0.5)"; ctx.setLineDash([5, 5]); ctx.stroke(); ctx.restore();
                }
            }};
            var render = function() {
                var ctx = document.getElementById("'.$id.'");
                if (!ctx || !window.Chart) return;
                if (window["inst_'.$id.'"]) window["inst_'.$id.'"].destroy();
                window["inst_'.$id.'"] = new Chart(ctx, {
                    type: "line", plugins: [vLine],
                    data: { labels: '.$jsonLabels.', datasets: '.$jsonDatasets.' },
                    options: {
                        nowIdx: '.($nowIdx !== null ? $nowIdx : "null").',
                        responsive: true, maintainAspectRatio: false,
                        plugins: { legend: { display: true, labels: { color: "#999", boxWidth: 10, font: { size: 10 } } } },
                        scales: {
                            x: { ticks: { color: "#bbb", maxTicksLimit: 9 }, grid: { display: false } },
                            y: { beginAtZero: true, ticks: { color: "#bbb" }, grid: { color: "rgba(255,255,255,0.1)" } }
                        }
                    }
                });
            };
            var check = setInterval(function() { if (window.Chart) { clearInterval(check); render(); } }, 100);
        })();
    </script>';
}
Kennst mich ja, ich kann ja die Finger von sowas nicht lassen und habe rumgespielt …
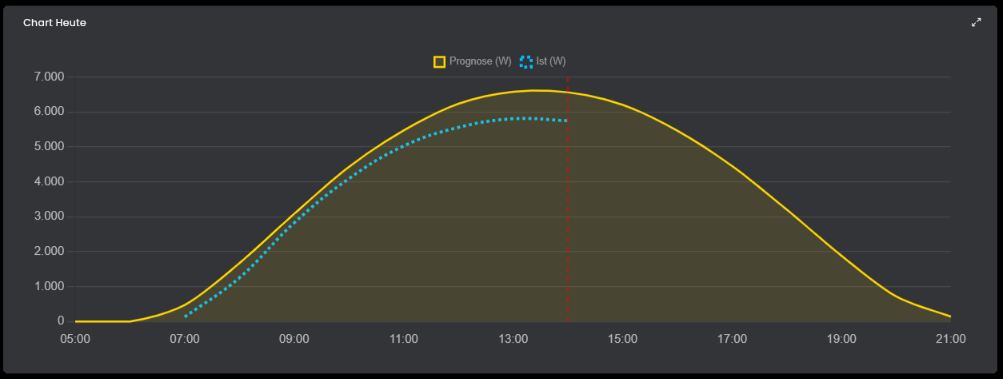
1.) Zeitversatz passte irgendwie nicht (die +1h wieder rausgenommen)
               // --- KORRIGIERTER SHIFT +1 ---
                $shifted_h = $h;
liegt wahrscheinlich wie die PV Anlage was meldet!
$url = "https://api.open-meteo.com/v1/dwd-icon?latitude=$lat&longitude=$lon&hourly=temperature_2m,global_tilted_irradiance&tilt=10&azimuth=-30&forecast_days=4&timezone=Europe%2FBerlin";
und dann die Berechnung geändert …
        // ZURÜCK ZUR BEWÄHRTEN FORMEL
        $total_rad_tilted = $hourly['global_tilted_irradiance'][$index];
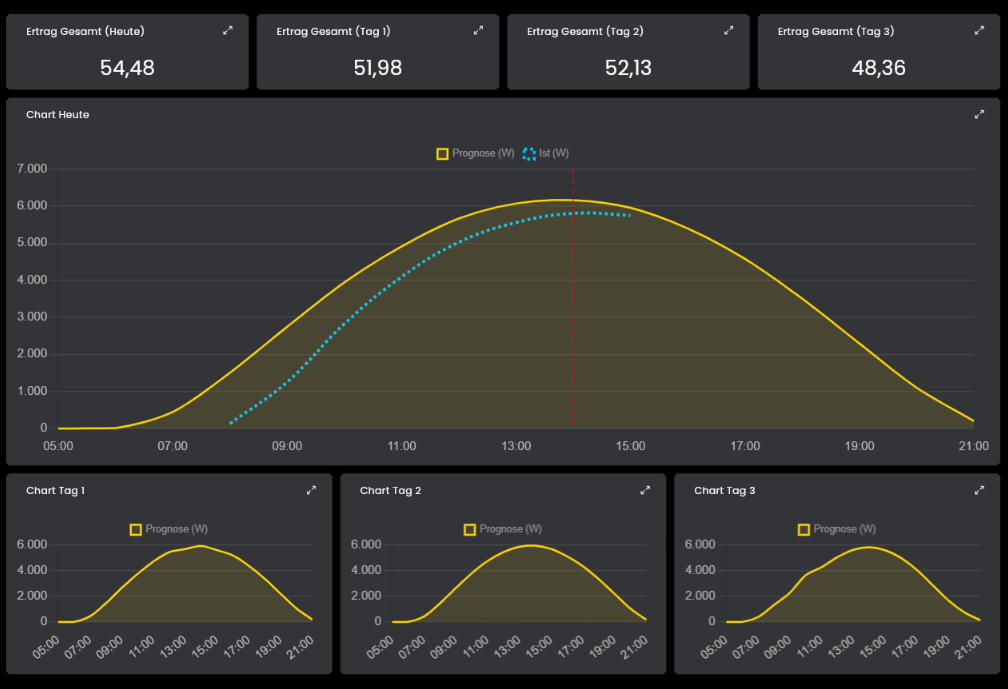
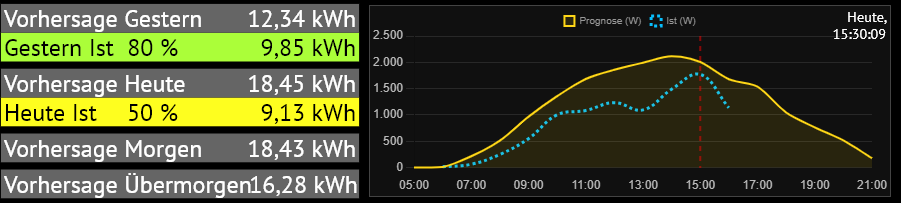
Damit sieht es jetzt bei mir so aus …
Den Versatz hatte ich genommen, da die Vorhersage immer nach ~1 Stunde früher aussah, wie die Solardaten.
Mit deiner Änderung geht die Vorhersage rasant nach oben, was sehr unwahrscheinlich ist.
Und bei mir genau umgekehrt
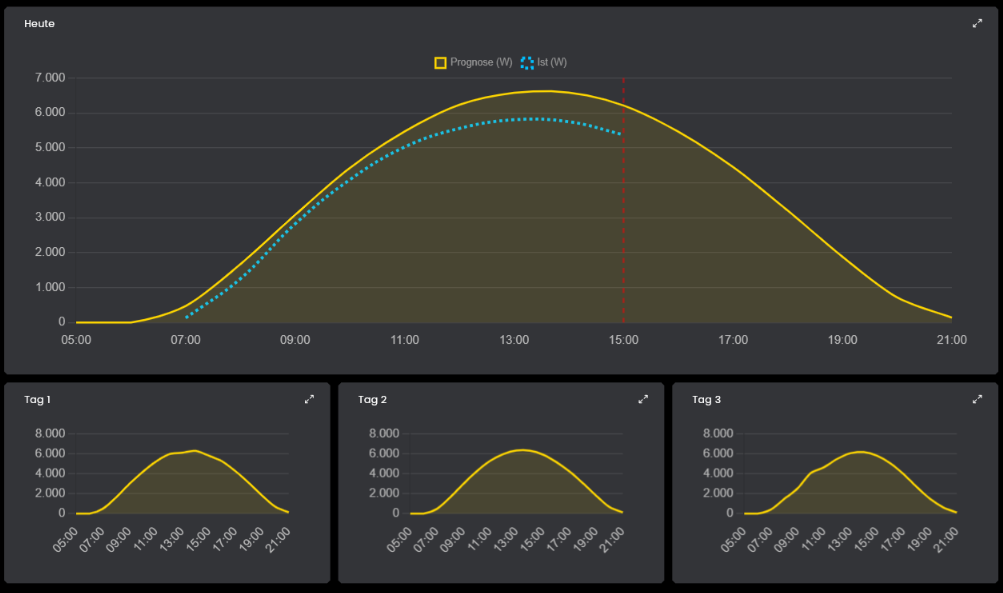
Musst ja nicht umstellen wenn Du gute Erfahrungen gemacht hast. Ich schau mir das die Tage mal an und vergleiche mit Solcast - läuft ja auch noch bei mir. Aber bis jetzt sieht es bei mir doch recht gut aus, oder?
DANKE jedenfalls für die sau gute Vorarbeit! Die API kannte ich noch gar nicht. Muss mal schauen wie die Wetterdaten so sind
Du meinst die Vorhersage ist immer höher als die tatsächliche Produktion. Das ist bei mir auch immer der Fall, aber SolCast ist(war) da schon mit den 3 Flanken (normal, besser, schlechter) schon sehr gut vom Ergebnissektor. Was ich hier gut finde, das hatte ich bei mir noch nicht gemacht, den Ist-Wert mit anzeigen zu lassen. Das macht es schon sehr anschaulich 
PS: habe noch die Labels für die Folgetage wegrationalisiert um mehr Platz zu schafffen
das ist ja das schöne an Scripten und HTML Strings 
Mal ne Fage zu Tilt…Winkel der PV Module?
…und bei Azimut bin ich mir auch unischer, weil @ralf für Süd1 und 2, 12° hat. Meine Anlage ist 178° Süd.
Man kann ja auch selbst mal googeln 
Danke
richimaint
0° = Die Module liegen komplett flach auf dem Boden oder einem Flachdach.
90° = Die Module hängen senkrecht (z. B. an einer Fassade).
und
0° = Exakt Süden
Positive Werte (+) = Abweichung nach Westen (+90° ist exakt West)
Negative Werte (-) = Abweichung nach Osten (-90° ist exakt Ost)
±180° = Exakt Norden
Sieht ehr so aus, als ob Du +1h machen solltest