Ich habe ein Seitenfenster im Homeoffice, bei dem die Sonne nachmittags so blöd einfällt, dass ich am Computer nichts mehr lesen kann. Also habe ich mir ein Skript gebastelt, um die Anfangs- und Endzeiten des störenden Sonneneinfalls in Abhängigkeit von folgenden konfigurierbaren Parametern zu berechnen:
- Azimut des Fensters
- Geographische Koordinaten des Hauses
- Vertikal/Horizontal des Einfallswinkels der Sonne aufs Fenster.
Kann benutzt werden, um Rollos zu steuern, z.B. um Sonneneinstrahlung nur bei direktem Einfallwinkel zu beschatten, somit Kühlung sparen und trotzdem viel Licht haben. Hier ist die Python-Version, weiter unten die PHP Version (auf Symcon getested und funktionell).
############################################################
# SUNLIGHT ON A WINDOW – YEARLY TIME TABLE + PLOT
#
# The window is upright (vertical glass).
#
# For each day of a given year, this script computes the
# local time interval where:
#
# 1) The sun is above the horizon.
# 2) The sun's elevation (angle above horizon) is
# between VERT_MIN_ANGLE and VERT_MAX_ANGLE.
# - Typically VERT_MIN_ANGLE = 0°, VERT_MAX_ANGLE = 45°.
# 3) The sun's azimuth lies within a horizontal cone of
# ±HORIZ_HALF_ANGLE around the window's outward normal
# (WINDOW_AZIMUTH).
#
# Physically, this corresponds to times when the sun hits
# an upright window within a specified vertical and horizontal
# angular range.
#
# The first such time in a day is reported as the "start time",
# the last such time as the "end time". For a west-facing
# window with VERT_MAX_ANGLE = 45°, the "start time" in late
# autumn will typically be when the sun DESCENDS through 45°
# elevation in the afternoon and enters the horizontal cone.
#
# Outputs:
# 1) CSV file with one row per day (date, start, end, duration).
# 2) Plot of start/end times over the year.
############################################################
############################################################
# INITIAL PARAMETERS (USER-MODIFIABLE)
############################################################
# Geographic coordinates of the house (Appenzell by default)
LATITUDE = 47.331 # degrees North
LONGITUDE = 9.409 # degrees East
# Window orientation: azimuth of the window’s outward normal.
# Convention: 0° = North, 90° = East, 180° = South, 270° = West.
# Example: 297.9° ≈ WNW, window facing "left" on the plan.
WINDOW_AZIMUTH = 297.9 # <-- MODIFY HERE
# Vertical angle constraints (sun elevation above horizon, in degrees).
# We typically want rays no higher than 45° above the horizon.
VERT_MIN_ANGLE = 0.0 # lower vertical bound (°)
VERT_MAX_ANGLE = 60.0 # upper vertical bound (°) – "sun ≤ 45°"
# Horizontal angle constraint around the window normal.
# Sun must be within ±HORIZ_HALF_ANGLE horizontally from perpendicular.
# For ±45°, we require:
# |azimuth_sun - WINDOW_AZIMUTH| ≤ 45° (modulo 360)
HORIZ_HALF_ANGLE = 60.0 # half-angle of horizontal acceptance cone (°)
# Time resolution for the scan (minutes)
TIME_STEP_MINUTES = 5 # smaller values → more precise, slower
# Year to compute
YEAR = 2025
# Approximate local time offset from UTC (CET ~ UTC+1, no DST handling here)
LOCAL_UTC_OFFSET_HOURS = 1
# Output CSV file name
OUTPUT_CSV = "sun_window_times.csv"
############################################################
# IMPORTS
############################################################
import math
import datetime as dt
import csv
from pathlib import Path
import matplotlib.pyplot as plt
############################################################
# SOLAR POSITION COMPUTATION (NOAA-STYLE APPROXIMATION)
############################################################
def julian_day(dt_utc):
"""
Compute the astronomical Julian Day (JD) for a given UTC datetime.
Parameters
----------
dt_utc : datetime.datetime
Naive datetime assumed to be in UTC.
Returns
-------
float
Julian Day number corresponding to dt_utc.
Notes
-----
The Julian Day is a continuous count of days since a reference epoch.
It is used internally by many astronomical algorithms.
"""
year = dt_utc.year
month = dt_utc.month
# Fractional day includes hours, minutes, seconds
day = dt_utc.day + (dt_utc.hour + dt_utc.minute/60 + dt_utc.second/3600) / 24.0
# For January and February, treat them as month 13 and 14 of previous year
if month <= 2:
year -= 1
month += 12
A = math.floor(year / 100)
B = 2 - A + math.floor(A / 4)
JD = (math.floor(365.25 * (year + 4716))
+ math.floor(30.6001 * (month + 1))
+ day + B - 1524.5)
return JD
def solar_position(dt_utc, lat_deg, lon_deg):
"""
Compute solar azimuth and elevation for a given UTC datetime and location.
Parameters
----------
dt_utc : datetime.datetime
Naive datetime assumed to be in UTC.
lat_deg : float
Geographic latitude in degrees (positive north).
lon_deg : float
Geographic longitude in degrees (positive east).
Returns
-------
(float, float)
A tuple (azimuth, elevation) in degrees:
- azimuth: 0–360°, measured from North clockwise
- elevation: degrees above the horizon
Notes
-----
This function implements an approximate algorithm similar to the
NOAA Solar Calculator. It is sufficiently accurate for architectural
sunlight studies (typical errors around a degree).
"""
jd = julian_day(dt_utc)
# Centuries from J2000.0
T = (jd - 2451545.0) / 36525.0
# Sun's geometric mean longitude (deg)
L0 = (280.46646 + T * (36000.76983 + T * 0.0003032)) % 360.0
# Sun's mean anomaly (deg)
M = 357.52911 + T * (35999.05029 - 0.0001537 * T)
# Eccentricity of Earth's orbit
e = 0.016708634 - T * (0.000042037 + 0.0000001267 * T)
# Sun's equation of center (deg)
Mrad = math.radians(M)
C = ((1.914602 - T * (0.004817 + 0.000014 * T)) * math.sin(Mrad)
+ (0.019993 - 0.000101 * T) * math.sin(2 * Mrad)
+ 0.000289 * math.sin(3 * Mrad))
# True longitude of the Sun (deg)
true_long = L0 + C
# Sun's apparent longitude (deg), corrected for nutation and aberration
omega = 125.04 - 1934.136 * T
lam = true_long - 0.00569 - 0.00478 * math.sin(math.radians(omega))
# Mean obliquity of the ecliptic (deg)
eps0 = 23 + (26 + ((21.448 - T * (46.815 + T * (0.00059 - 0.001813 * T))) / 60.0)) / 60.0
# Corrected obliquity (deg)
eps = eps0 + 0.00256 * math.sin(math.radians(omega))
# Sun's declination (deg)
sin_decl = math.sin(math.radians(eps)) * math.sin(math.radians(lam))
decl = math.degrees(math.asin(sin_decl))
# Equation of time (minutes)
y = math.tan(math.radians(eps / 2.0)) ** 2
L0_rad = math.radians(L0)
E_time = 4.0 * math.degrees(
y * math.sin(2 * L0_rad)
- 2 * e * math.sin(Mrad)
+ 4 * e * y * math.sin(Mrad) * math.cos(2 * L0_rad)
- 0.5 * y * y * math.sin(4 * L0_rad)
- 1.25 * e * e * math.sin(2 * Mrad)
)
# True solar time (minutes)
minutes = dt_utc.hour * 60 + dt_utc.minute + dt_utc.second / 60.0
tst = (minutes + E_time + 4 * lon_deg) % 1440.0 # time zone = 0 (UTC)
# Hour angle (deg): negative before solar noon, positive after
if tst / 4.0 < 0:
ha = tst / 4.0 + 180.0
else:
ha = tst / 4.0 - 180.0
# Convert to radians
lat_rad = math.radians(lat_deg)
ha_rad = math.radians(ha)
decl_rad = math.radians(decl)
# Solar zenith angle (deg)
cos_zenith = (
math.sin(lat_rad) * math.sin(decl_rad) +
math.cos(lat_rad) * math.cos(decl_rad) * math.cos(ha_rad)
)
cos_zenith = max(-1.0, min(1.0, cos_zenith)) # numeric safety
zenith = math.degrees(math.acos(cos_zenith))
# Elevation angle above horizon (deg)
elevation = 90.0 - zenith
# Solar azimuth (deg, 0–360 from north, clockwise)
sin_az = -math.sin(ha_rad) * math.cos(decl_rad) / math.cos(math.radians(elevation))
cos_az = (
(math.sin(decl_rad) - math.sin(lat_rad) * math.sin(math.radians(elevation)))
/ (math.cos(lat_rad) * math.cos(math.radians(elevation)))
)
azimuth = math.degrees(math.atan2(sin_az, cos_az))
azimuth = (azimuth + 360.0) % 360.0
return azimuth, elevation
############################################################
# YEARLY SCAN
############################################################
def compute_times_for_year():
"""
Compute daily direct-sun intervals for the specified YEAR.
Direct sun on the window is defined as times when all of:
1) elevation > 0° (sun above horizon),
2) VERT_MIN_ANGLE < elevation <= VERT_MAX_ANGLE,
3) horizontal angle |Δazimuth| ≤ HORIZ_HALF_ANGLE, where
Δazimuth is the smallest signed difference between
sun azimuth and WINDOW_AZIMUTH in [-180°, +180°].
For each day, we:
- Scan local times from 04:00 to 22:00 in steps of TIME_STEP_MINUTES.
- Convert local time to UTC using LOCAL_UTC_OFFSET_HOURS.
- Compute solar (azimuth, elevation).
- Check the conditions above.
- Collect all matching times for that day.
- Store the earliest match as "start_time_local",
the latest match as "end_time_local", and the duration
in hours between them.
Returns
-------
list of dict
Each dict has keys:
- "date" (YYYY-MM-DD)
- "start_time_local" (HH:MM, local, or "" if never)
- "end_time_local" (HH:MM, local, or "" if never)
- "duration_hours" (float, hours)
"""
results = []
for day in range(1, 366):
date = dt.date(YEAR, 1, 1) + dt.timedelta(days=day - 1)
# Stop if we've rolled into the next year (handles leap vs non-leap)
if date.year != YEAR:
break
# Local scan range: 04:00–22:00
start_local = dt.datetime.combine(date, dt.time(4, 0))
end_local = dt.datetime.combine(date, dt.time(22, 0))
t = start_local
matches = []
while t <= end_local:
# Convert approximate local time to UTC
t_utc = t - dt.timedelta(hours=LOCAL_UTC_OFFSET_HOURS)
az, el = solar_position(t_utc, LATITUDE, LONGITUDE)
# Sun must be above horizon and within vertical interval
if el > 0.0 and VERT_MIN_ANGLE < el <= VERT_MAX_ANGLE:
# Horizontal condition: sun within ±HORIZ_HALF_ANGLE of window normal
delta_az = ((az - WINDOW_AZIMUTH + 180.0) % 360.0) - 180.0
if abs(delta_az) <= HORIZ_HALF_ANGLE:
matches.append(t)
t += dt.timedelta(minutes=TIME_STEP_MINUTES)
if matches:
first = matches[0]
last = matches[-1]
duration_hours = (last - first).total_seconds() / 3600.0
results.append({
"date": date.isoformat(),
"start_time_local": first.time().strftime("%H:%M"),
"end_time_local": last.time().strftime("%H:%M"),
"duration_hours": round(duration_hours, 2),
})
else:
# No direct sun for this day under the chosen constraints
results.append({
"date": date.isoformat(),
"start_time_local": "",
"end_time_local": "",
"duration_hours": 0.0,
})
return results
############################################################
# CSV WRITING
############################################################
def write_csv(results, path):
"""
Write the list of daily results to a CSV file.
Parameters
----------
results : list of dict
Output of compute_times_for_year(). Each dict must have:
"date", "start_time_local", "end_time_local", "duration_hours".
path : str or pathlib.Path
Output file path.
Side Effects
------------
Creates or overwrites the CSV file at the given path.
"""
path = Path(path)
with path.open("w", newline="") as f:
writer = csv.DictWriter(
f,
fieldnames=["date", "start_time_local", "end_time_local", "duration_hours"]
)
writer.writeheader()
writer.writerows(results)
print(f"Saved table to: {path.resolve()}")
############################################################
# PLOTTING
############################################################
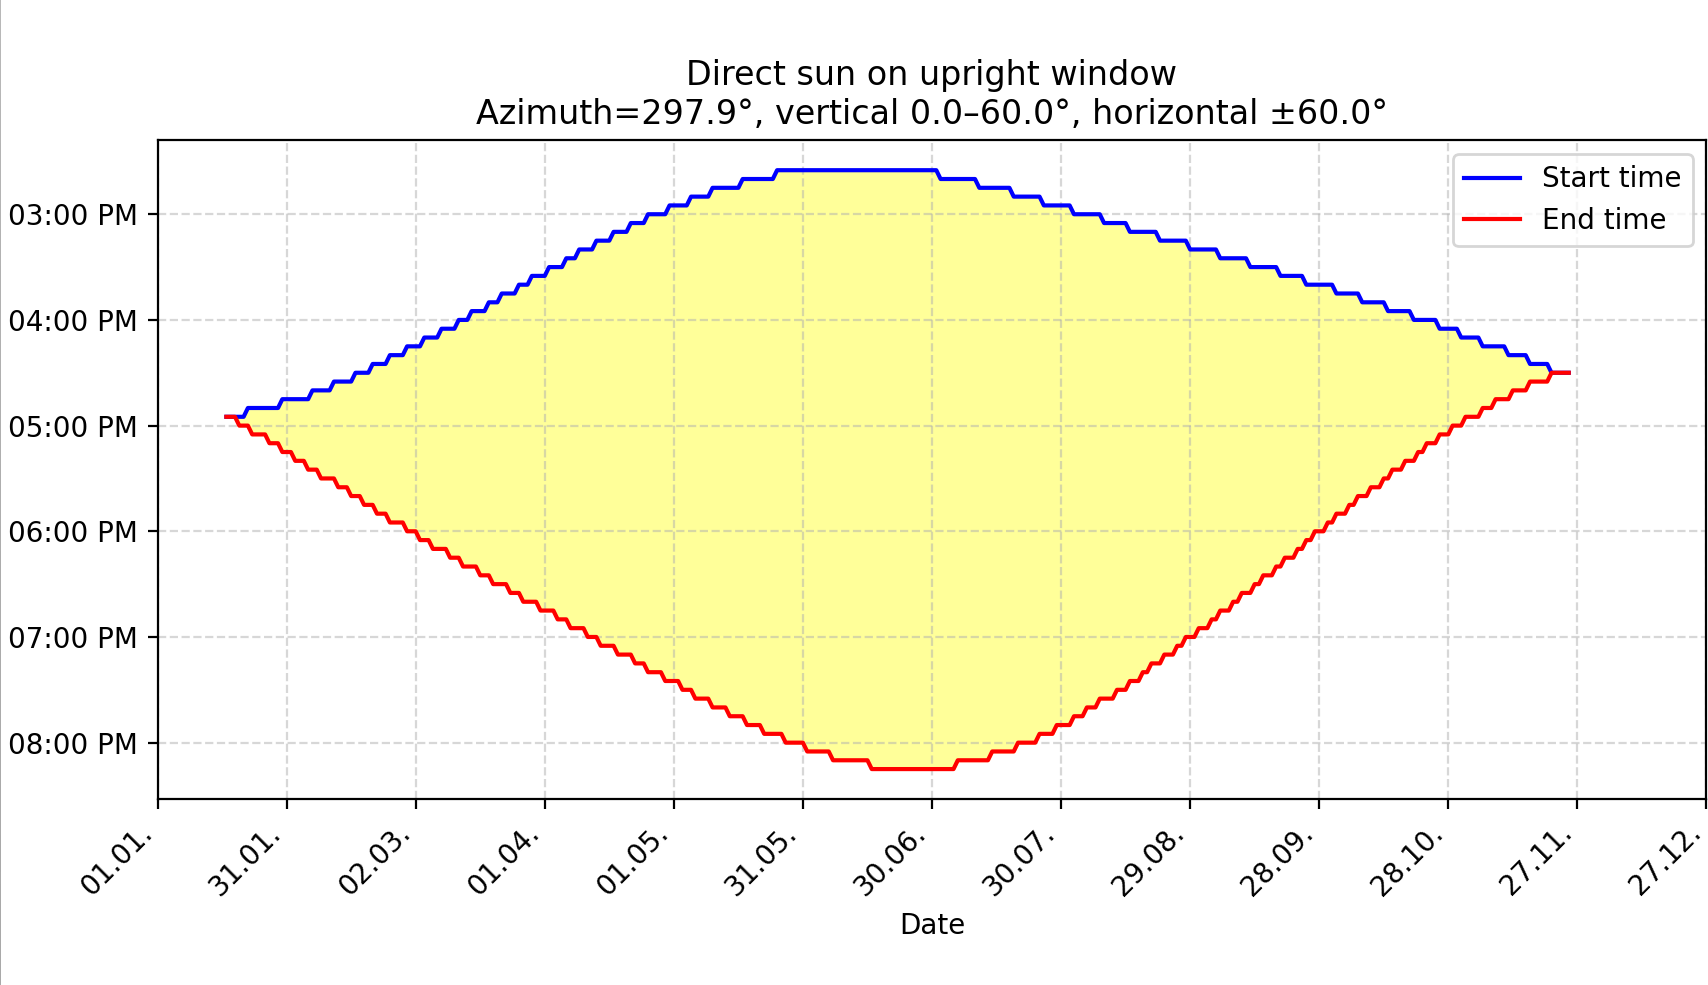
def plot_results(results):
"""
Plot the start and end local times of direct sun on the window
over the course of the year, with:
- y-axis in hh:mm AM/PM
- earlier times at the top (inverted axis)
- yellow shading between start and end time curves.
"""
import datetime as dt
import math
import matplotlib.pyplot as plt
import matplotlib.ticker as ticker
import numpy as np
date_labels = []
start_hours = []
end_hours = []
for r in results:
# Convert "YYYY-MM-DD" → "dd.mm."
y, m, d = map(int, r["date"].split("-"))
date_obj = dt.date(y, m, d)
date_labels.append(date_obj.strftime("%d.%m."))
if r["start_time_local"]:
sh, sm = map(int, r["start_time_local"].split(":"))
eh, em = map(int, r["end_time_local"].split(":"))
start_hours.append(sh + sm / 60.0)
end_hours.append(eh + em / 60.0)
else:
start_hours.append(math.nan)
end_hours.append(math.nan)
x = np.arange(len(results))
plt.figure(figsize=(12, 4))
# Plot lines
plt.plot(x, start_hours, label="Start time", color="blue")
plt.plot(x, end_hours, label="End time", color="red")
# --- Fill region between curves (yellow) ---
plt.fill_between(
x,
start_hours,
end_hours,
where=~np.isnan(start_hours) & ~np.isnan(end_hours),
color="yellow",
alpha=0.4,
interpolate=True
)
plt.xlabel("Date")
plt.ylabel("Local Time (hh:mm AM/PM)")
plt.title(
"Direct sun on upright window\n"
f"Azimuth={WINDOW_AZIMUTH}°, vertical {VERT_MIN_ANGLE}–{VERT_MAX_ANGLE}°, "
f"horizontal ±{HORIZ_HALF_ANGLE}°"
)
plt.legend()
plt.grid(True, linestyle="--", alpha=0.5)
# --- Format Y axis as hh:mm AM/PM ---
def format_hhmm_ampm(x, pos):
if math.isnan(x):
return ""
hour = int(x)
minute = int((x - hour) * 60)
t = dt.time(hour % 24, minute)
return t.strftime("%I:%M %p")
ax = plt.gca()
ax.yaxis.set_major_formatter(ticker.FuncFormatter(format_hhmm_ampm))
ax.yaxis.set_major_locator(ticker.MultipleLocator(1)) # 1 hour steps
# --- Invert y-axis so earlier times appear on top ---
ax.invert_yaxis()
# --- X-axis date labels every ~30 days ---
tick_positions = list(range(0, len(x), 30))
tick_labels = [date_labels[i] for i in tick_positions]
plt.xticks(tick_positions, tick_labels, rotation=45, ha="right")
plt.tight_layout()
plt.show()
############################################################
# MAIN
############################################################
if __name__ == "__main__":
# 1. Compute daily sun-illumination intervals
results = compute_times_for_year()
# 2. Write them to CSV
write_csv(results, OUTPUT_CSV)
# 3. Plot start/end times over the year
plot_results(results)