Sorry, stimmt.
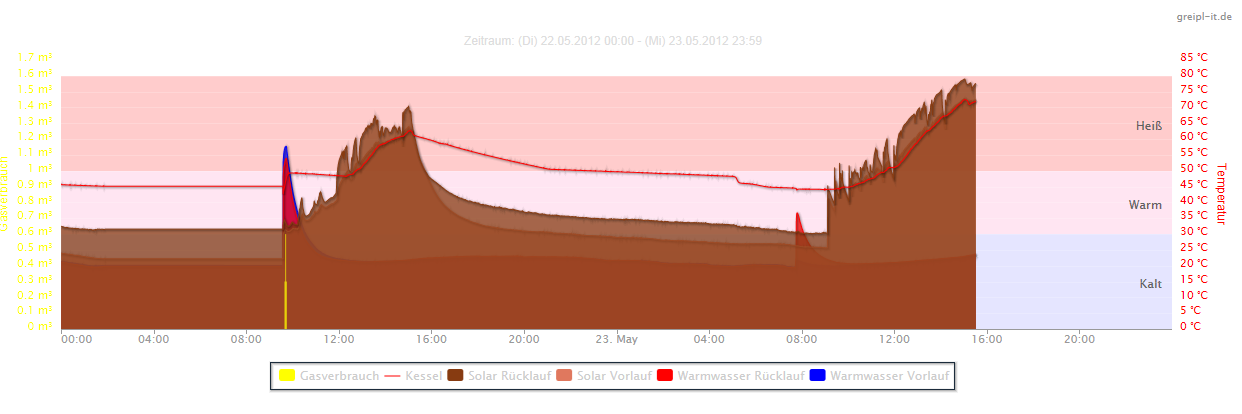
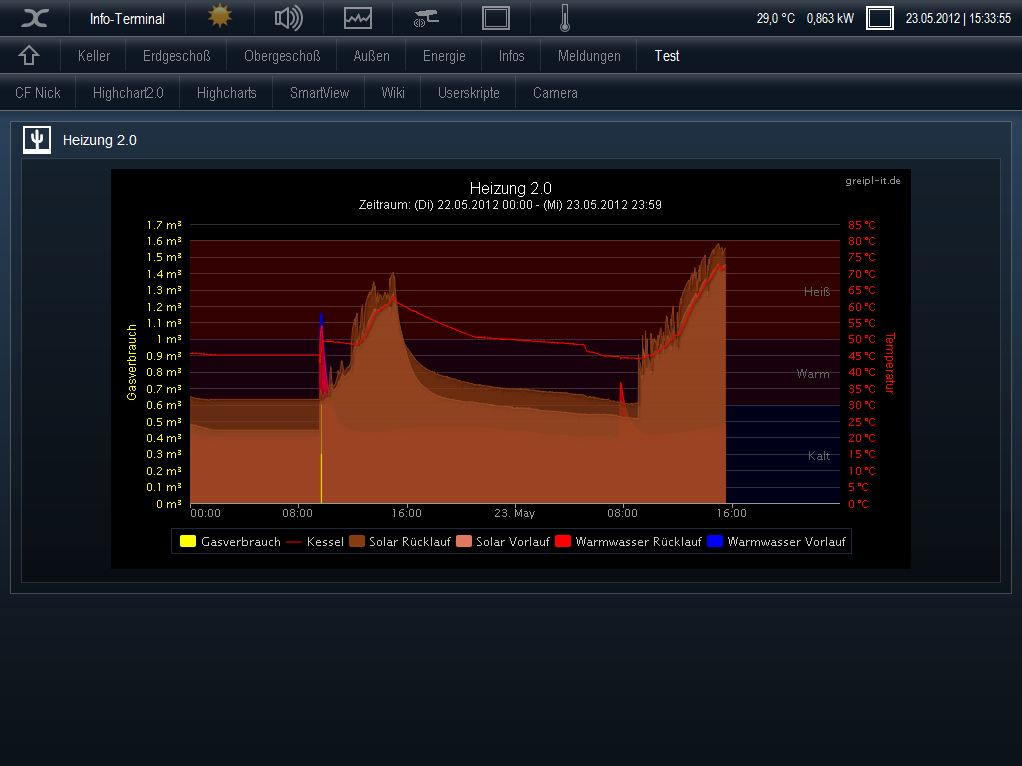
Aber auch mit dem neuen sieht es nicht besser aus 
<!DOCTYPE HTML PUBLIC "-//W3C//DTD HTML 4.01//EN" "http://www.w3.org/TR/html4/strict.dtd">
<html>
 <head>
  <meta http-equiv="Content-Type" content="text/html; charset=utf-8">
  <title>Highcharts</title>

  <!-- 1. Add these JavaScript inclusions in the head of your page -->
  <script type="text/javascript" src="http://ajax.googleapis.com/ajax/libs/jquery/1.4.2/jquery.min.js"></script>
  <script type="text/javascript" src="js/highcharts.js"></script>

  <!-- 1a) Optional: add a theme file -->
  <!--
   <script type="text/javascript" src="js/themes/gray.js"></script>
   <script type="text/javascript" src="js/themes/grid.js"></script>
   <script type="text/javascript" src="../../js/themes/ips.js"></script>
  -->
   <script type="text/javascript" src="../../js/themes/ips.js"></script>

  <!-- 1b) Optional: the exporting module -->
  <script type="text/javascript" src="js/modules/exporting.js"></script>


  <!-- 2. Add the JavaScript to initialize the chart on document ready -->

  <script type="text/javascript">
  var chart;
   Highcharts.setOptions({lang:{decimalPoint:',',thousandsSep:'.',months:['Januar','Februar','M\u00e4rz','April','Mai','Juni','Juli','August','September','Oktober','November','Dezember'],shortMonths:['Jan','Feb','M\u00e4r','Apr','Mai','Jun','Jul','Aug','Sep','Okt','Nov','Dez'],weekdays:['Sonntag','Montag','Dienstag','Mittwoch','Donnerstag','Freitag','Samstag']}});

   $(document).ready(function() {
    chart = new Highcharts.Chart({
chart:{zoomType:'x',animation:false,renderTo:'container'},credits:{enabled:true,href:'',text:'greipl-it.de',position:{align:'right',x:-10,verticalAlign:'top',y:15}},legend:{borderRadius:0,borderColor:'#1b2b3b',shadow:true},exporting:{enabled:false,buttons:{printButton:{enabled:false}}},title:{text:'Heizung 2.0'},subtitle:{text:'Zeitraum: (Di) 22.05.2012 00:00 - (Mi) 23.05.2012 23:59'},tooltip:{useHTML:true,shared:true,crosshairs:[{width:1,color:'grey',dashStyle:'dashdot'},{width:1,color:'grey',dashStyle:'dashdot'}],formatter:function() {var s = '<b>' + Highcharts.dateFormat('%H:%M', this.x) +'<\/b>';                $.each(this.points, function(i, point) {                     var unit = {'Gasverbrauch': 'm\u00b3','Kessel': '\u00b0C','Solar R\u00fccklauf': '\u00b0C','Solar Vorlauf': '\u00b0C','Warmwasser R\u00fccklauf': '\u00b0C','Warmwasser Vorlauf': '\u00b0C','': '',}[this.series.name];                    s += '<br\/>' + '<b><span style=color:' + point.series.color + '>' + point.series.name +': <\/span><\/b>' + point.y + unit;                });                return s;            }},xAxis:{type:'datetime',dateTimeLabelFormats:{second:'%H:%M:%S',minute:'%H:%M',hour:'%H:%M',day:'%e. %b',week:'%e. %b',month:'%b %y',year:'%Y'},allowDecimals:false,min:Date.UTC(2012,4,22,00,00,00),max:Date.UTC(2012,4,23,23,59,59)},yAxis:[{title:{text:'Gasverbrauch',style:{color:'#FFFF00'}},Unit:'m\u00b3',opposite:false,tickInterval:0.1,min:0,max:1.2,labels:{style:{color:'#FFFF00'},formatter:function() { return this.value +' m\u00b3'; }}},{title:{text:'Temperatur',style:{color:'#FF0000'}},Unit:'\u00b0C',opposite:true,tickInterval:5,min:0,max:null,labels:{style:{color:'#FF0000'},formatter:function() { return this.value +' \u00b0C'; }},plotBands:[{zIndex:null,from:0,to:30,color:'rgba(0, 0, 255, 0.1)',label:{text:'Kalt',align:'right',x:-10,style:{color:'#606060'}}},{zIndex:null,from:30,to:50,color:'rgba(255, 0, 127, 0.1)',label:{text:'Warm',align:'right',x:-10,style:{color:'#606060'}}},{zIndex:null,from:50,to:80,color:'rgba(255, 0, 0, 0.2)',label:{text:'Hei\u00df',align:'right',x:-10,style:{color:'#606060'}}}]}],series:[{Id:42353,type:'area',zIndex:10,color:'#FFFF00',step:true,yAxis:0,shadow:true,lineWidth:0,states:{hover:{lineWidth:2}},marker:{enabled:false,states:{hover:{enabled:true,symbol:'circle',radius:4,lineWidth:1}}},name:'Gasverbrauch',data:[[Date.UTC(2012,4,22,00,00,00),0],[Date.UTC(2012,4,22,09,35,37),0],[Date.UTC(2012,4,22,09,39,25),0.3],[Date.UTC(2012,4,22,09,41,25),0.6],[Date.UTC(2012,4,22,09,43,25),0.3],[Date.UTC(2012,4,22,09,45,25),0],[Date.UTC(2012,4,23,11,27,30),0],[Date.UTC(2012,4,23,21,01,56),0]]},{Id:48704,type:'line',zIndex:5,color:'#FF0000',step:false,yAxis:1,shadow:true,lineWidth:1,states:{hover:{lineWidth:2}},marker:{enabled:false,states:{hover:{enabled:true,symbol:'circle',radius:4,lineWidth:1}}},name:'Kessel',data

---> DATA gelöscht.

  </script>
 </head>

 <body>

  <!-- 3. Add the container -->
  <div id="container" style="width: 100%; height: 400px; margin: 0 auto"></div>
 </body>
</html>