Hallo Ralf,
ich hab mir damit auch mal gespielt. Ist eigentlich relativ einfach.
- Du brauchst nur die 3 .class Dateien in den Script Ordner kopieren.
- neues Script erstellen
- die class per include einbinden
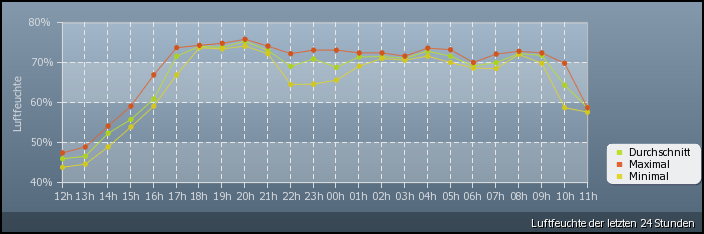
- Graphen zeichnen
<?
 // Standard inclusions
include('pData.class');
include('pChart.class');

$IDAC = 11320; 				//ArchivControl
$IDAussentemp = 20798;		//Variable die die geloggten Werte enthält

//stündliche Werte :	0
//werte einlesen von: vor 24h ( time()-3600*24)
//					bis jetzt (time() )
//Limit:				99
$buffer = AC_GetAggregatedValues($IDAC,$IDAussentemp,0,time()-3600*24,time(),99);
krsort($buffer); // Array umdrehen da sonst der Graph von rechts nach links gezeichnet wird

 // Dataset definition
$DataSet = new pData;
foreach ($buffer as $werte){
	$DataSet->AddPoint($werte["Min"],"MIN");
	$DataSet->AddPoint($werte["Max"],"MAX");
	$DataSet->AddPoint($werte["Avg"],"AVG");
	$DataSet->AddPoint(date("H",$werte["TimeStamp"]),"TIME");
}

$DataSet->AddAllSeries();
$DataSet->RemoveSerie("TIME");
$DataSet->SetAbsciseLabelSerie("TIME");  //Y-Achsen Einteilung
$DataSet->SetSerieName("MaxTemp","MAX");
$DataSet->SetSerieName("Durchschnitt","AVG");
$DataSet->SetSerieName("MinTemp","MIN");
$DataSet->SetYAxisName("Temperatur");
$DataSet->SetYAxisUnit("°C");

 // Initialise the graph
$Graph = new pChart(700,240);
$Graph->setFontProperties("tahoma.ttf",8);
$Graph->setGraphArea(70,30,680,200);
$Graph->drawFilledRoundedRectangle(7,7,693,223,5,240,240,240);
$Graph->drawRoundedRectangle(5,5,695,225,5,230,230,230);
$Graph->drawGraphArea(255,255,255,TRUE);
$Graph->drawScale($DataSet->GetData(),$DataSet->GetDataDescription(),SCALE_NORMAL,150,150,150,TRUE,0,2);
$Graph->drawGraphArea(250,250,250);
$Graph->drawGrid(4,true,230,230,230,2);

 // Draw the 0 line
$Graph->setFontProperties("tahoma.ttf",6);
$Graph->drawTreshold(0,143,55,72,TRUE,TRUE);

 // Draw the line graph
$Graph->drawCubicCurve($DataSet->GetData(),$DataSet->GetDataDescription());

 // Finish the graph
$Graph->setFontProperties("tahoma.ttf",8);
$Graph->drawLegend(75,35,$DataSet->GetDataDescription(),250,250,250);
$Graph->setFontProperties("tahoma.ttf",10);
$Graph->drawTitle(60,22,"Aussentemperatur",50,50,50,585);
$Graph->setFontProperties("tahoma.ttf",8);
$Graph->Render(IPS_GetKernelDir()."media/Aussen.png");
?>