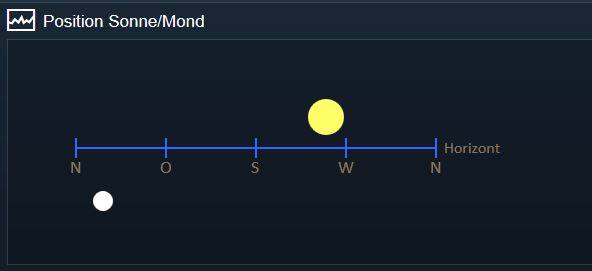
so, hier mal ein vorläufiges Ergebnis dessen was ich darstellen wollte…
Position von Sonne und Mond - man hat ja sonst nichts zu tun 
<?

// Anzeige der Position von Sonne und Mond im WF
// Erstellung der Grafik mit "Canvas" (HTML-Element)
// siehe https://de.wikipedia.org/wiki/Canvas_(HTML-Element)
// 2016-04-25 Bernd Hoffmann

//Daten für Nullpunkt usw.------------------------------------------------------
$npx = 50;        //Nullpunkt x-achse
$npy = 50;        //Nullpunkt y-achse
$z = 40;       	//Offset y-achse

$lWt = 2;         //Linienstärke Teilstriche
$lWh = 2;         //Linienstärke Horizontlinie

//Waagerechte Linie-------------------------------------------------------------
$l1 = 360;        //Länge der Horizontlinie

$x1 = $npx;			//Nullpunkt waagerecht
$y1 = $npy+$z;		//Nullpunkt senkrecht
$x2 = $x1+$l1;		//Nullpunkt + Länge = waagerechte Linie
$y2 = $npy+$z;

//Teilstriche-------------------------------------------------------------------
$l2 = 10;         //Länge der Teilstriche
//N 0°
$x3 = $npx;   		//Nullpunkt waagerecht
$y3 = $y1-$l2/2;	//Nullpunkt senkrecht
$x4 = $x3;
$y4 = $y3+$l2;		//Nullpunkt + Länge = senkrechte Linie
//O
$x5 = $npx+90;
$y5 = $y1-$l2/2;
$x6 = $x5;
$y6 = $y5+$l2;
//S
$x7 = $npx+180;
$y7 = $y1-$l2/2;
$x8 = $x7;
$y8 = $y7+$l2;
//W
$x9 = $npx+270;
$y9 = $y1-$l2/2;
$x10 = $x9;
$y10 = $y9+$l2;
//N 360°
$x11 = $npx+360;
$y11 = $y1-$l2/2;
$x12 = $x11;
$y12 = $y11+$l2;

//Daten von Sonne und Mond holen------------------------------------------------
$xsun = $npx + getvalue(11512 /*[Astronomische Daten\Sonne\Azimut]*/);
$ysun = $npy + $z - getvalue(33283 /*[Astronomische Daten\Sonne\Höhe]*/);

$xmoon = $npx + getvalue(48142 /*[Astronomische Daten\Mond\Azimut]*/);
$ymoon = $npy + $z - getvalue(48649 /*[Astronomische Daten\Mond\Höhe]*/);

//Erstellung der Html Datei-----------------------------------------------------
$html =
'<html>

<head>
<script type="text/javascript">

function draw(){
var canvas = document.getElementById("canvas1");
if(canvas.getContext){
	var ctx = canvas.getContext("2d");

	ctx.lineWidth = '.$lWt.'; //Teilstriche
	ctx.strokeStyle = "rgb(51,102,255)";
	ctx.beginPath();
	ctx.moveTo('.$x3.','.$y3.');
	ctx.lineTo('.$x4.','.$y4.');
	ctx.stroke();
	ctx.beginPath();
	ctx.moveTo('.$x5.','.$y5.');
	ctx.lineTo('.$x6.','.$y6.');
	ctx.stroke();
	ctx.beginPath();
	ctx.moveTo('.$x7.','.$y7.');
	ctx.lineTo('.$x8.','.$y8.');
	ctx.stroke();
	ctx.beginPath();
	ctx.moveTo('.$x9.','.$y9.');
	ctx.lineTo('.$x10.','.$y10.');
	ctx.stroke();
	ctx.beginPath();
	ctx.moveTo('.$x11.','.$y11.');
	ctx.lineTo('.$x12.','.$y12.');
	ctx.stroke();

	ctx.lineWidth = 2; //Text
	ctx.fillStyle = "rgb(139,115,85)";
	ctx.beginPath();
	ctx.font = "18px calibri";
   ctx.fillText("N", '.$x4.'-6,'.$y4.'+15);
   ctx.fillText("O", '.$x6.'-6,'.$y6.'+15);
   ctx.fillText("S", '.$x8.'-5,'.$y8.'+15);
   ctx.fillText("W", '.$x10.'-8,'.$y10.'+15);
   ctx.fillText("N", '.$x12.'-6,'.$y12.'+15);
   ctx.font = "16px calibri";
   ctx.fillText("Horizont", '.$x1.'+368,'.$y1.'+5);

	ctx.lineWidth = '.$lWh.'; //Horizontlinie
	ctx.strokeStyle = "rgb(51,102,255)";
	ctx.beginPath();
	ctx.moveTo('.$x1.','.$y1.');
	ctx.lineTo('.$x2.','.$y2.');
	ctx.stroke();

	ctx.lineWidth = 1; //Mond
	ctx.fillStyle = "rgb(255,255,255)";
	ctx.beginPath();
   ctx.arc('.$xmoon.','.$ymoon.',10,0,Math.PI*2,true);
   ctx.fill();

   ctx.lineWidth = 1; //Sonne
	ctx.fillStyle = "rgb(255,255,102)";
	ctx.beginPath();
   ctx.arc('.$xsun.','.$ysun.',18,0,Math.PI*2,true);
   ctx.fill();
	}
}

</script>
</head>

<body onload="draw()">
<canvas id="canvas1" width="800" height="180" > //style="border:1px solid yellow;"
</canvas>
</body>

</html>';

//Erstellen des Dateinamens, abspeichern und Aufruf in <iframe>-----------------
$filename = "sunmoonline.php";
$fullFilename = IPS_GetKernelDir()."webfront\user\\".$filename;
$handle = fopen($fullFilename, "w");
fwrite($handle, $html);
fclose($handle);
$HTMLData = '<iframe src="/user/sunmoonline.php" border="0" frameborder="0" style= "width: 100%; height: 200px;"/></iframe>';

setvalue(41928 /*[Astronomische Daten\Allgemein\Position Sonne/Mond]*/,$HTMLData);


?>