HighchartsPHP

BestEx darf seit heute Nachmittag schon mit spielen,
nun gibts den offiziellen Download mit Text und bunten Bildern.

V 0.2 der RS HighChartPHP Spielwiese, nun mit vollständig integrierter HighStock-Library und passendem HighStock Beispiel:

OHLC-Chart (Temperatur-Entwicklung über 365 Tage)

Wie immer mit dem Project Exporter exportiert, somit sind Update/Installation eine One-Click-Angelegenheit (fast)

BestEx ist begeistert von dem Tool :). @Raketenschnecke ich weiss nicht wie Du das zeitlich alles hinbekommst. Erste Sahne !!!
Ich hatte schon mehrfach versucht mal schnell Highcharts zu erstellen. Bin immer gescheitert und jetzt klappts ohne Probleme
Erfahrungsbericht mit Bildern folgt …

Sent from my iPad using Tapatalk HD

Hi Leute,

Gibt es eigentlich noch mehr Einstellungsmöglichkeiten für Gauge? Wie bekomme ich z.B. den weißen Hintergrund transparent? Kann man eigentlich noch zusätzlich den Temperaturwert statisch im Gauge hinterlegen?

Hi sunni2002,

kannst du mal deinen Code Teilen ?

Klaro kann ich :wink:

<?php
    if (!isset($_IPS['getHTML'])){
       $idOfContentVariable = IPS_GetParent($_IPS['SELF']);  // eine String Variable mit Profil ~HTML
        $scriptId = $_IPS['SELF'];
        $s = "<iframe src='./user/IPS-HighchartsPHP.php?ScriptId=$scriptId' width='70%' height='600' frameborder='0' scrolling='no' ></iframe>";
        SetValueString($idOfContentVariable, $s);
        return;
    }


require_once "Ghunti/HighchartsPHP/Highchart.php";
require_once "Ghunti/HighchartsPHP/HighchartJsExpr.php";
require_once "Ghunti/HighchartsPHP/HighchartOption.php";
require_once "Ghunti/HighchartsPHP/HighchartOptionRenderer.php";

use Ghunti\HighchartsPHP\Highchart;
use Ghunti\HighchartsPHP\HighchartJsExpr;
$chart = new Highchart();
$chart->includeExtraScripts();

$chart->chart = array(
    'type' => 'gauge',
    'plotBackgroundColor' => null,
    'plotBackgroundImage' => null,
    'plotBorderWidth' => 0,
    'plotShadow' => false
);
$chart->title->text = 'Temperatur Wohnzimmer';
$chart->pane->startAngle = -150;
$chart->pane->endAngle = 150;
$chart->background = array(
    array(
        'backgroundColor' => array(
            'linearGradient' => array(
                'x1' => 0,
                'y1' => 0,
                'x2' => 0,
                'y2' => 1
            ),
            'stops' => array(
                array(0, '#FFF'),
                array(1, '#333')
            )
        ),
        'borderWidth' => 0,
        'outerRadius' => '109%'
    ),
    array(
        'backgroundColor' => array(
            'linearGradient' => array(
                'x1' => 0,
                'y1' => 0,
                'x2' => 0,
                'y2' => 1
            ),
            'stops' => array(
                array(0, '#333'),
                array(1, '#FFF')
            )
        ),
        'borderWidth' => 1,
        'outerRadius' => '107%'
    ),
    array(
        'backgroundColor' => '#DDD',
        'borderWidth' => 0,
        'outerRadius' => '105%',
        'innerRadius' => '103%'
    )
);
$chart->yAxis = array(
    'min' => 15,
    'max' => 30,
    'minorTickInterval' => 'auto',
    'minorTickWidth' => 1,
    'minorTickLength' => 10,
    'minorTickPosition' => 'inside',
    'minorTickColor' => '#666',
    'tickPixelInterval' => 30,
    'tickWidth' => 2,
    'tickPosition' => 'inside',
    'tickLength' => 10,
    'tickColor' => '#666',
    'labels' => array(
        'step' => 0.5,
        'rotation' => 'auto'
    ),
    'title' => array(
        'text' => '°C'
    ),
    'plotBands' => array(
        array(
            'from' => 0,
            'to' => 19,
            'color' => '#2E2EFE'
        ),
        array(
            'from' => 19,
            'to' => 23,
            'color' => '#FACC2E'
        ),
        array(
            'from' => 23,
            'to' => 40,
            'color' => '#FE2E2E'
        )
    )
);
$chart->series[] = array(
    'name' => 'Temperatur',
    'data' => array(70),
    'tooltip' => array(
        'valueSuffix' => '°C'
    )
);

ob_start();
$chart->printScripts();
$hc_scripts = ob_get_contents();
ob_end_clean();

$hc_renderOptions =  $chart->renderOptions();

$varId = 34301 /*[Heizung\Wohnzimmer\Sensor\HK4 Temperatur]*/ ; //Variable welche angezeigt werden soll

$s='
<html>
    <head>
        <meta http-equiv="Content-Type" content="text/html; charset=utf-8" />
          '.$hc_scripts.'
    </head>
    <body>
        <div id="container"></div>

        <script type="text/javascript" >


            function getvalCallback(callback){
                $.getJSON(\'GetValueFromIPSVariable.php?VarId='.$varId.'\', function(data) {
                    callback(data);
                });
            }

            function CallbackFunc(data){
                var chart = $(\'#container\').highcharts();
                var point = chart.series[0].points[0],
                            newVal,
                            inc = 0;

                var newVal =  Number(data);

                point.update(newVal);
            };

                $(\'#container\').highcharts(
                '. $hc_renderOptions . ',
                // Add some life
                function (chart) {
                    if (!chart.renderer.forExport) {
                        setInterval(function () {getvalCallback(CallbackFunc) }, 1000);
                    }
                }
            );
        </script>
    </body>
</html>';
echo $s;

?>

Nachdem ich mich jetzt ausgiebig mit der Spielwiese von @Raketenschnecke beschäftigt habe möchte ich Euch die Ergebnisse nicht vorenthalten.
Nochmals großes Kompliment an @Rakentenschnecke, ich habe die beigefügten Charts ohne Probleme erstellen können.

Darüber hinaus konnte ich es nicht lassen und habe etwas mit dem PHP Code gespielt und zum Beispiel bei den HighStock Charts nicht den letzten Wert des Tages eingetragen sondern den Mittelwert (Temperatur + Luftdruck)
Übrigens Henry ist der Name für unseren Automower.
Also viel Spaß beim anschauen der Bilder und ich kann nur jedem der Lust verspürt das selbst mal auszuprobieren raten es einfach mal zu machen, mit Hilfe der Spielwiese in Verbindung mit dem Projekt Exporter ist das wirklich kinderleicht.

Temperatur.JPGLuftdruck.JPGSonnenstatus.JPG

kosten.JPG

Sehr schön aber ehrlicherweise blick ich gerade nicht durch, was da läuft. Sind das nun zwischen Raketenschnecke und khc völlig unterschiedliche Herangehensweisen oder liegt der Unterschied nur in der automatisierten Installation. Ich möcht´s nicht erst installieren müssen, um das herauszufinden.
Irgendwie verwirrend dieser Mix im Thread.

Beides: völlig unterschiedliche Herangehensweise und volloutomatische Installation. Was hält Dich davon ab, beides zu probieren?

Zeit! Ich lasse dann die Anderen herausfinden, welches Konzept trägt.
Never change a running system.

Aber nette Dinge, die ihr da macht.

Moin Moin,

das mit der Gauge klappt nun auch bei mir Dank Zorro, wie bekommt man ein paar davon ohne Splitt nebeneinander ?

Alles in allem ist das super schnell und sieht echt gut aus .

Hallo,

ich habe gerade versucht die Analoguhr von Highcharts einzubauen.
Leider ohne Erfolg.
Ich bekomme auch keine Fehlermeldung.
Hat das schon jemand am Laufen?

<?php
    if (!isset($_IPS['getHTML'])){
       $idOfContentVariable = IPS_GetParent($_IPS['SELF']);  // eine String Variable mit Profil ~HTML
        $scriptId = $_IPS['SELF'];
        $s = "<iframe src='./user/IPS-HighchartsPHP.php?ScriptId=$scriptId' width='100%' height='600' frameborder='0' scrolling='no' ></iframe>";
        SetValueString($idOfContentVariable, $s);
        return;
    }


require_once "Ghunti/HighchartsPHP/Highchart.php";
require_once "Ghunti/HighchartsPHP/HighchartJsExpr.php";
require_once "Ghunti/HighchartsPHP/HighchartOption.php";
require_once "Ghunti/HighchartsPHP/HighchartOptionRenderer.php";

use Ghunti\HighchartsPHP\Highchart;
use Ghunti\HighchartsPHP\HighchartJsExpr;
use Ghunti\HighchartsPHP\HighchartOption;
use Ghunti\HighchartsPHP\HighchartOptionRenderer;


$chart = new Highchart();
$chart->includeExtraScripts();
$backgroundOptions = new HighchartOption();
$backgroundOptions->radialGradient = array(
    'cx' => 0.5,
    'cy' => -0.4,
    'r' => 1.9
);
$backgroundOptions->stops = array(
    array(0.5, 'rgba(255, 255, 255, 0.2)'),
    array(0.5, 'rgba(200, 200, 200, 0.2)')
);

$chart->chart = array(
    'type' => 'gauge',
    'plotBackgroundColor' => null,
    'plotBackgroundImage' => null,
    'plotBorderWidth' => 0,
    'plotShadow' => false,
    //'height' => 200
);
$chart->credits->enabled = false;
$chart->title->text = 'The Highcharts clock';
$chart->pane->background = array(
    new stdClass(),
    array(
        'backgroundColor' => new HighchartJsExpr(
            'Highcharts.svg ? ' . HighchartOptionRenderer::render($backgroundOptions) . ' : null'
        )
    )
);
$chart->yAxis = array(
    'labels' => array(
        'distance' => -20
    ),
    'min' => 0,
    'max' => 12,
    'lineWidth' => 0,
    'showFirstLabel' => false,

    'minorTickInterval' => 'auto',
    'minorTickWidth' => 1,
    'minorTickLength' => 5,
    'minorTickPosition' => 'inside',
    'minorGridLineWidth' => 0,
    'minorTickColor' => '#666',

    'tickInterval' => 1,
    'tickWidth' => 2,
    'tickPosition' => 'inside',
    'tickLength' => 10,
    'tickColor' => '#666',

    'title' => array(
        'text' => 'Powered by<br/>Isi',
        'style' => array(
            'color' => '#BBB',
            'fontWeight' => 'normal',
            'fontSize' => '8px',
            'lineHeight' => '10px'
        ),
        'y' => 10
    )
);
$chart->tooltip->formatter = new HighchartJsExpr('function () { return this.series.chart.tooltipText; }');
$chart->series[] = array(
    'data' =>array(
        array(
            'id' => 'hour',
            'y' => new HighchartJsExpr('now.hours'),
            'dial' => array(
                'radius' => '60%',
                'baseWidth' => 4,
                'baseLength' => '95%',
                'rearLength' => 0
            )
        ),
        array(
            'id' => 'minute',
            'y' => new HighchartJsExpr('now.minutes'),
            'dial' => array(
                'baseLength' => '95%',
                'rearLength' => 0
            )
        ),
        array(
            'id' => 'second',
            'y' => new HighchartJsExpr('now.seconds'),
            'dial' => array(
                'radius' => '100%',
                'baseWidth' => 1,
                'rearLength' => '20%'
            )
        )
    ),
    'animation' => false,
    'dataLabels' => array(
        'enabled' => false
    )
);

Hi Leute,

Könnte man mit den neuen HighchartsPHP auch Stacked bars basteln?
http://www.highcharts.com/demo/bar-stacked/dark-unica
Wie müsste der Code hier aussehen?

Hallo zusammen,
falls es noch jemanden interessiert …
Darauf gibts noch keine Antwort:

Wie bekomme ich z.B. den weißen Hintergrund transparent?

Hier die Antwort:

$chart->chart = array(
    'backgroundColor' => "rgba(255,255,255, 0.0)"

PS: ist von der RS-Spielwiese.

Hi Wolfgang,

Klasse! :smiley: Danke … hat funktioniert :wink:

Hallo,

ich habe dann auch mal ein wenig mit der Spielwiese gespielt und ein wenig für die Nutzung von Postgresql abgeändert.
Hier also erst mal die Postgresql Funktion, einfügen in das „RS IPS Functions“ Script,


function PG_Array_to_HCData($Variable, $von, $bis, $agg, $vartype)
{
date_default_timezone_set("UTC");
$start = date('d.m.Y H:i:s',$von);
$ende = date('d.m.Y H:i:s',$bis);
$count = 1;
$var_old = 0;
$var_old1 = 0;
$wert_old = 0;
$sperre = 0;
$durchschnitt = 0;
$summe = 0;
$pgdaten = array();
unset ($pgdaten);
$timing = $agg * 60;
$steps = ceil ((($bis - $von) / 60) / $agg);
$dbconn = pg_connect("host=192.168.X.X port=5432 dbname=ipsgraphenlogging user=ips password=ips") or die ('Verbindungsaufbau fehlgeschlagen: ' . pg_last_error());
$query = "SELECT *
FROM (select ('$start'::timestamp + s * '$timing seconds'::interval) AS updatezeit
FROM generate_Series(0,$steps)s)
foo left join
(
SELECT to_timestamp(trunc(date_part('epoch', updatezeit)/$timing) * $timing) at time zone 'UTC' AS updatezeit,
       count(*) as thecount,
       round (cast(avg (value)as numeric),1) as avg,
       round (cast(min (value)as numeric),1) as min,
       round (cast(max (value)as numeric),1) as max
FROM variablen WHERE updatezeit >= '$start UTC' AND varid = '$Variable'
GROUP BY to_timestamp(trunc(date_part('epoch', updatezeit)/$timing) * $timing) at time zone 'UTC'
ORDER BY updatezeit
) as n2
using(updatezeit)
order by 1
";
$result = pg_query($query) or die ('Abfrage fehlgeschlagen: ' . pg_last_error());
//
pg_close($dbconn);
//

if ($vartype == 1)
{
while ($werte = pg_fetch_row($result))
{
if ($werte[4] > 0)
{
If ($wert_old > 0)
{
$maxwert =  $werte[4] - $wert_old;
$summe = ($summe + $maxwert);
$durchschnitt = $summe / $count;
$count++;
$wert_old = $werte[4];
}
else
{
$wert_old = $werte[4];
}
}
}
}
//
pg_result_seek($result, 0);
//
while ($werte = pg_fetch_row($result))
{
if ($werte[2] == "")
{
$temp = 0;
}
else
{
$temp = floatval($werte[2]);
}
if ($vartype == 1)
{
$temp = floatval($werte[4]);
$sperre = 0;
if ($var_old == 0 AND $temp > 0)
{
$var_old = $temp;
$temp = 0;
$sperre = 1;
}
if ($var_old > 0 AND $temp == 0 AND $sperre == 0)
{
$temp = 0;
$sperre = 1;
}
if ($var_old > 0 AND $temp > 0 AND $sperre == 0)
{
$var_old1 = $temp;
$temp = $temp - $var_old;
$var_old = $var_old1;
$sperre = 1;
}
if ($var_old == 0 AND $temp == 0 AND $sperre == 0)
{
$temp = 0;
}
if ($temp > ($durchschnitt * 3)) // Falsche Werte filtern
{
$temp = 0;
}
}
$temp = round($temp,1);

$time = strtotime($werte[0]) * 1000;
$pgdaten[] = array($time, $temp);
}

	$result1    = $pgdaten;

	return $result1;
	}

Im Beispielscrit muss folgendes geändert werden.
Unter User Config:


$IPS_Strom_VarType                                       = 1; // 0 = Standard, 1 = Zähler
$IPS_Temperatur_VarType                                  = 0; // 0 = Standard, 1 = Zähler

Unter Zeitraum einfügen:


$agg                                                     = 360; // zusammenfassung von Minuten


$chart->series[$S_ID]->data 	= PG_Array_to_HCData($IPS_Strom_VarID, $ts, $te, $agg, $IPS_Strom_VarType);

Schöne Grüße
Thomas

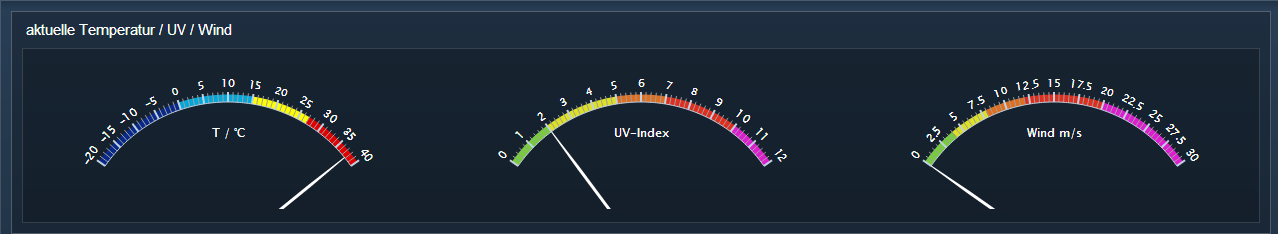
Ich hab ein bisschen mit den VU-Meter Beispielen herumgespielt…

Dazu der Code:


<?php
    if (!isset($_IPS['getHTML'])){
       $idOfContentVariable = IPS_GetParent($_IPS['SELF']);  // eine String Variable mit Profil ~HTML
        $scriptId = $_IPS['SELF'];
        $s = "<iframe src='./user/IPS-HighchartsPHP.php?ScriptId=$scriptId' width='100%' height='150' frameborder='0' scrolling='no' ></iframe>";
        SetValueString($idOfContentVariable, $s);
        return;
    }

$varId = 12419 /*[Garten\Klima\Netatmo Wetterstation\OutdoorModule_Temperature]*/ ; //Variable welche angezeigt werden soll
$varId2 = 17332 /*[Garten\Klima\UV-Sensor\UV-Index]*/;
$varId3 = 16687 /*[Garten\Klima\Windmesser\Windgeschwindigkeit]*/;

require_once "Ghunti/HighchartsPHP/Highchart.php";
require_once "Ghunti/HighchartsPHP/HighchartJsExpr.php";
require_once "Ghunti/HighchartsPHP/HighchartOption.php";
require_once "Ghunti/HighchartsPHP/HighchartOptionRenderer.php";

use Ghunti\HighchartsPHP\Highchart;
use Ghunti\HighchartsPHP\HighchartJsExpr;

$chart = new Highchart();
$chart->includeExtraScripts();
$chart->credits = array (
  'enabled' => false
);
$chart->exporting = array (
  'enabled' => false
);


$chart->chart = array(
    'type' => 'gauge',
    'backgroundColor' => "rgba(255,255,255, 0.0)",
    'plotBorderWidth' => 0,
    'plotBackgroundImage' => null,
    'height' => 200
);
$chart->title->text = '';
$chart->pane = array(
    array(
        'startAngle' => -55,
        'endAngle' => 55,
        'background' => null,
        'center' => array('15%', '100%'),
        'size' => 300,
        'lineColor' => '#FFFFFF'
    ),
    array(
        'startAngle' => -55,
        'endAngle' => 55,
        'background' => null,
        'center' => array('50%', '100%'),
        'size' => 300
    ),
    array(
        'startAngle' => -55,
        'endAngle' => 55,
        'background' => null,
        'center' => array('85%', '100%'),
        'size' => 300
    )
);
$chart->yAxis = array(
    array(
        'min' => -20,
        'max' => 40,
        'minorTickPosition' => 'outside',
        'tickPosition' => 'outside',
        'tickInterval' => 5,
        'labels' => array(
            'rotation' => 'auto',
            'distance' => 15,
            'step' => 1,
            'style' => array(
				  'color' => '#FFFFFF'
				),
        ),
        'plotBands' => array(
            array(
                'from' => -20,
                'to' => 0,
                'color' => '#08298A',
                'innerRadius' => '100%',
                'outerRadius' => '105%'
            ),
            array(
                'from' => 0,
                'to' => 15,
                'color' => '#01A9DB',
                'innerRadius' => '100%',
                'outerRadius' => '105%'
            ),
            array(
                'from' => 15,
                'to' => 27,
                'color' => '#FFFF00',
                'innerRadius' => '100%',
                'outerRadius' => '105%'
            ),
            array(
                'from' => 27,
                'to' => 40,
                'color' => '#DF0101',
                'innerRadius' => '100%',
                'outerRadius' => '105%'
            )
        ),
        'pane' => 0,
        'title' => array(
            'text' => '<span style="color:white">T / °C</span>',
            'y' => -40
        )
    ),
    array(
        'min' =>0,
        'max' => 12,
        'minorTickPosition' => 'outside',
        'tickPosition' => 'outside',
        'tickInterval' => 1,
        'labels' => array(
            'rotation' => 'auto',
            'distance' => 15,
            'style' => array(
				  'color' => '#FFFFFF'
				),
        ),
        'plotBands' => array(
            array(
                'from' => 0,
                'to' => 2,
                'color' => 'rgba(129, 223, 62, 0.9)',
                'innerRadius' => '100%',
                'outerRadius' => '105%'
            ),
            array(
                'from' => 2,
                'to' => 5,
                'color' => 'rgba(244, 247, 35, 0.9)',
                'innerRadius' => '100%',
                'outerRadius' => '105%'
            ),
           array(
                'from' => 5,
                'to' => 7,
                'color' => 'rgba(245, 119, 29, 0.9)',
                'innerRadius' => '100%',
                'outerRadius' => '105%'
            ),
         array(
                'from' => 7,
                'to' => 10,
                'color' => 'rgba(245, 47, 29, 0.9)',
                'innerRadius' => '100%',
                'outerRadius' => '105%'
            ),
         array(
                'from' => 10,
                'to' => 12,
                'color' => 'rgba(245, 29, 227, 0.9)',
                'innerRadius' => '100%',
                'outerRadius' => '105%'
            )
        ),
        'pane' => 1,
        'title' => array(
            'text' => '<span style="color:white">UV-Index</span>',
            'y' => -40
        )
    ),
    array(
        'min' =>0,
        'max' => 30,
        'minorTickPosition' => 'outside',
        'tickPosition' => 'outside',
        'tickInterval' => 2.5,
        'labels' => array(
            'rotation' => 'auto',
            'distance' => 15,
            'style' => array(
				  'color' => '#FFFFFF'
				),
        ),
        'plotBands' => array(
            array(
                'from' => 0,
                'to' => 4,
                'color' => 'rgba(129, 223, 62, 0.9)',
                'innerRadius' => '100%',
                'outerRadius' => '105%'
            ),
            array(
                'from' => 4,
                'to' => 8,
                'color' => 'rgba(244, 247, 35, 0.9)',
                'innerRadius' => '100%',
                'outerRadius' => '105%'
            ),
           array(
                'from' => 8,
                'to' => 12,
                'color' => 'rgba(245, 119, 29, 0.9)',
                'innerRadius' => '100%',
                'outerRadius' => '105%'
            ),
         array(
                'from' => 12,
                'to' => 20,
                'color' => 'rgba(245, 47, 29, 0.9)',
                'innerRadius' => '100%',
                'outerRadius' => '105%'
            ),
         array(
                'from' => 20,
                'to' => 30,
                'color' => 'rgba(245, 29, 227, 0.9)',
                'innerRadius' => '100%',
                'outerRadius' => '105%'
            )
        ),
        'pane' => 2,
        'title' => array(
            'text' => '<span style="color:white">Wind m/s</span>',
            'y' => -40
        )
    )
);
$chart->plotOptions->gauge->dataLabels->enabled = true;
$chart->plotOptions->gauge->dial->backgroundColor = 'white';
$chart->plotOptions->gauge->dial->radius = '100%';
$chart->tooltip->valueSuffix = '';
$chart->tooltip->followPointer = true;
$chart->series = array(
    array(
        'data' => array(GetValue($varId /*[Garten\Klima\Netatmo Wetterstation\OutdoorModule_Temperature]*/)),
        'title' => 'Temperatur',
        'name' => 'Temperatur',
        'tooltip' => array(
        'valueSuffix' => ' °C'
        ),
        'yAxis' => 0
    ),
    array(
        'data' => array(GetValue($varId2 /*[Garten\Klima\UV-Sensor\UV-Index]*/)),
        'name' => 'UV-Index',
        'tooltip' => array(
        'valueSuffix' => ''
        ),
        'yAxis' => 1
    ),
    array(
        'data' => array(GetValue($varId3 /*[Garten\Klima\Windmesser\Windgeschwindigkeit]*/)),
        'name' => 'Windgeschwindigkeit',
        'tooltip' => array(
        'valueSuffix' => ' m/s'
        ),
        'yAxis' => 2
    )
);
ob_start();
$chart->printScripts();
$hc_scripts = ob_get_contents();
ob_end_clean();

$hc_renderOptions =  $chart->renderOptions();

//echo $hc_renderOptions;
//return;


$s='
<html>
    <head>
        <meta http-equiv="Content-Type" content="text/html; charset=utf-8" />
          '.$hc_scripts.'
    </head>
    <body>
        <div id="container"></div>

        <script type="text/javascript" >


            function getvalCallback(callback){
                $.getJSON(\'GetValueFromIPSVariable.php?VarId='.$varId.'\', function(data) {
                    callback(data);
                
                });
            }

            function getvalCallback2(callback){
                $.getJSON(\'GetValueFromIPSVariable.php?VarId='.$varId2.'\', function(data) {
                    callback(data);

                });
            }
            function getvalCallback3(callback){
                $.getJSON(\'GetValueFromIPSVariable.php?VarId='.$varId3.'\', function(data) {
                    callback(data);

                });
            }
            function CallbackFunc(data){
                var chart = $(\'#container\').highcharts();
                var point = chart.series[0].points[0],
                            newVal,
                            inc = 0;

                var newVal =  Number(data);
                point.update(newVal);
            };
            function CallbackFunc2(data){
                var chart = $(\'#container\').highcharts();
                var point = chart.series[1].points[0],
                            newVal,
                            inc = 0;

                var newVal =  Number(data);
                point.update(newVal);
            };
            function CallbackFunc3(data){
                var chart = $(\'#container\').highcharts();
                var point = chart.series[2].points[0],
                            newVal,
                            inc = 0;

                var newVal =  Number(data);
                point.update(newVal);
            };

                $(\'#container\').highcharts(
                '. $hc_renderOptions . ',
                // Add some life
                function (chart) {
                    if (!chart.renderer.forExport) {
                        setInterval(function () {getvalCallback(CallbackFunc) }, 1000);
                        setInterval(function () {getvalCallback2(CallbackFunc2) }, 1000);
                        setInterval(function () {getvalCallback3(CallbackFunc3) }, 1000);
                    }
                }
            );
        </script>
    </body>
</html>';
echo $s;

?>


Grüße
hoep

… und hier ein Stacked Bar Beispiel …

Stacked Bar.jpg

<?php
    if (!isset($_IPS['getHTML'])){
       $idOfContentVariable = IPS_GetParent($_IPS['SELF']);  // eine String Variable mit Profil ~HTML
        $scriptId = $_IPS['SELF'];
        $s = "<iframe src='./user/IPS-HighchartsPHP.php?ScriptId=$scriptId' width='100%' height='250' frameborder='0' scrolling='no' ></iframe>";
        SetValueString($idOfContentVariable, $s);
        return;
    }


require_once "Ghunti/HighchartsPHP/Highchart.php";
require_once "Ghunti/HighchartsPHP/HighchartJsExpr.php";
require_once "Ghunti/HighchartsPHP/HighchartOption.php";
require_once "Ghunti/HighchartsPHP/HighchartOptionRenderer.php";

use Ghunti\HighchartsPHP\Highchart;
use Ghunti\HighchartsPHP\HighchartJsExpr;
$chart = new Highchart();
$chart->includeExtraScripts();

$chart->credits = array (
  'enabled' => false
);
$chart->exporting = array (
  'enabled' => false
);

$chart->chart = array(
    'type' => 'bar',
    'backgroundColor' => null,
    'plotBackgroundImage' => null,
    'plotBorderWidth' => 0,
    'plotShadow' => false,
    'height' => 250
);

$chart->title = array(
		'text'			=> 'Speichermanagment',
		'align'        => 'center',
		'x'            => 50,
		'style' => array(
		   'color' => '#FFFFFF',
		   'fontSize' => '16px'
		),
);

$chart->xAxis = array(
	'categories'			=> array('Raspberry Küche', 'NAS hdd1', 'NAS hdd2'),
);

$chart->yAxis = array(
    'min' 	=> 0,
    'max'   => 100,
    'title' => array(
        'text' 	=> '%',
	 	  'style' => array(
	 	  	 'color'   => '#FFFFFF'
	 ),
    ),
);

$chart->legend = array(
	'align' => 'center',
	'x' => 50,
	 	  'style' => array(
	 	  	 'color'   => '#FFFFFF'
	 ),
);
$chart->plotOptions = array(
	'bar' => array(
		'stacking'   => 'percent',
	 )
);
$varId1 = 48611 /*[Technik\Küche\Raspberry\Storage\Verfügbar]*/; //Variable welche angezeigt werden soll
$varId2 = 38471 /*[Technik\Küche\Raspberry\Storage\Verbraucht]*/; //Variable welche angezeigt werden soll

$varId3 = 56612 /*[Technik\Zimmer\NAS\Storage hdd1\Verfügbar]*/; //Variable welche angezeigt werden soll
$varId4 = 48061 /*[Technik\Zimmer\NAS\Storage hdd1\Verbraucht]*/; //Variable welche angezeigt werden soll

$varId5 = 15296 /*[Technik\Zimmer\NAS\Storage hdd2\Verfügbar]*/; //Variable welche angezeigt werden soll
$varId6 = 20253 /*[Technik\Zimmer\NAS\Storage hdd2\Verbraucht]*/; //Variable welche angezeigt werden soll

$chart->series[] = array(
    'name' => 'Verfügbar',
    'data' => array(GetValue($varId1),GetValue($varId3),GetValue($varId5)),
	 'color' => 'white',
    'dataLabels' => array(
	 	'enabled' => 'true',
	   'color'  => 'black',
	   'format' => '{point.y:.1f} GB'
	 ),
    'tooltip' => array(
        'valueSuffix' => ' GB'
    ),
);
$chart->series[] = array(
    'name' => 'Verbraucht',
    'data' => array(GetValue($varId2),GetValue($varId4),GetValue($varId6)),
	 'color' => '#70bffa',
	 'dataLabels' => array(
	 	'enabled' => 'true',
	   'color'  => 'black',
	   'format' => '{point.y:.1f} GB'
	 ),
    'tooltip' => array(
        'valueSuffix' => ' GB'
    ),
);


ob_start();
$chart->printScripts();
$hc_scripts = ob_get_contents();
ob_end_clean();

$hc_renderOptions =  $chart->renderOptions();


$s='
<html>
    <head>
        <meta http-equiv="Content-Type" content="text/html; charset=utf-8" />
          '.$hc_scripts.'
    </head>
    <body>
        <div id="container"></div>

        <script type="text/javascript" >


            function getvalCallback1(callback){
                $.getJSON(\'GetValueFromIPSVariable.php?VarId='.$varId1.'\', function(data) {
                    callback(data);
                });
            }
            function getvalCallback2(callback){
                $.getJSON(\'GetValueFromIPSVariable.php?VarId='.$varId2.'\', function(data) {
                    callback(data);
                });
            }
            function getvalCallback3(callback){
                $.getJSON(\'GetValueFromIPSVariable.php?VarId='.$varId3.'\', function(data) {
                    callback(data);
                });
            }
            function getvalCallback4(callback){
                $.getJSON(\'GetValueFromIPSVariable.php?VarId='.$varId4.'\', function(data) {
                    callback(data);
                });
            }
            function getvalCallback5(callback){
                $.getJSON(\'GetValueFromIPSVariable.php?VarId='.$varId5.'\', function(data) {
                    callback(data);
                });
            }
            function getvalCallback6(callback){
                $.getJSON(\'GetValueFromIPSVariable.php?VarId='.$varId6.'\', function(data) {
                    callback(data);
                });
            }

            function CallbackFunc1(data){
                var chart = $(\'#container\').highcharts();
                var point = chart.series[0].points[0],
                            newVal,
                            inc = 0;

                var newVal =  Number(data);

                point.update(newVal);
            };
            function CallbackFunc2(data){
                var chart = $(\'#container\').highcharts();
                var point = chart.series[1].points[0],
                            newVal,
                            inc = 0;

                var newVal =  Number(data);

                point.update(newVal);
            };
            function CallbackFunc3(data){
                var chart = $(\'#container\').highcharts();
                var point = chart.series[1].points[0],
                            newVal,
                            inc = 0;

                var newVal =  Number(data);

                point.update(newVal);
            };
            function CallbackFunc4(data){
                var chart = $(\'#container\').highcharts();
                var point = chart.series[1].points[0],
                            newVal,
                            inc = 0;

                var newVal =  Number(data);

                point.update(newVal);
            };
            function CallbackFunc5(data){
                var chart = $(\'#container\').highcharts();
                var point = chart.series[1].points[0],
                            newVal,
                            inc = 0;

                var newVal =  Number(data);

                point.update(newVal);
            };
            function CallbackFunc6(data){
                var chart = $(\'#container\').highcharts();
                var point = chart.series[1].points[0],
                            newVal,
                            inc = 0;

                var newVal =  Number(data);

                point.update(newVal);
            };

                $(\'#container\').highcharts(
                '. $hc_renderOptions . ',
                // Add some life
                function (chart) {
                    if (!chart.renderer.forExport) {
                        setInterval(function () {getvalCallback(CallbackFunc) }, 1000);
                    }
                }
            );
        </script>
    </body>
</html>';
echo $s;

?>

Hallo,

hat sich einer schon mal mit dem Drilldown auseinander gesetzt? Ich fänd das wäre ne heiße Sache für den Energiebereich. Um von Tag auf Stunde oder eventuell dann noch tiefer (Rohdaten) zu gehen. Leider reichen meine Kenntnisse nicht aus um es selber zu Programmieren, aber anreize kann man ja mal geben. :rolleyes:

Gruß Maik

Der Drilldown ist für die nächste Version des „RS Energy Forecast“ fest eingeplant

Könntest du dann auch mal ein Beispiel in die HighchartsPHP Spielwiese legen?